|
Back
Linda:
Here is what I had written down for your 3 questions (please let me
know if I got them incorrectly):
1) how many professors/courses expressed a ranking (preference list)
at all?
2) of those who expressed a ranking, how many got their 1st choice?
how many got any of their choices?
3) of those who expressed a preference ranking, how many did they ask
for (that is, how many TA's did they list)?
Here is what i found out.(*)
There were 99 courses/profs, 204 TA's, and 200 "slots" (TA positions)
Of these 99, 67 expressed preferences for TA's
Of these 67, 61 expressed preferences for TA's who were available(**)
Of these 61, 29 got their first choice
37 got 1 or more of their top 3 choices
40 got 1 or more of any of their choices
(*) Please note that these findings are based only on the output of
the hospital-resident algorithm, which I sent you in email -- NOT
to the eventual published solution put out by the Graduate Office
online. Nor does it take into account any "post-publishing" manual
adjustments that were made by John in order to accomodate changes
in student or professor schedules, etc.
(**) Many expressed preferences for graduate students who did not
express their own preferences (ie. prof Johnson wanted Mary to TA
for them, but Mary did not sign in and fill out her preferences,
indicating she was available for TA'ship). This shortened the
preference list for many professors. For instance, some
professors who had listed 6 TA's ended up listing only 4
*available* TA's. In the extreme case, 6 professors even had
their preference lists reduced to length 0 because of this. Thus,
38 now express no (available) TA preferences at all, instead of
32.
--------
Here are some simple histograms of the actual distribution of number
of choices expressed by professors.
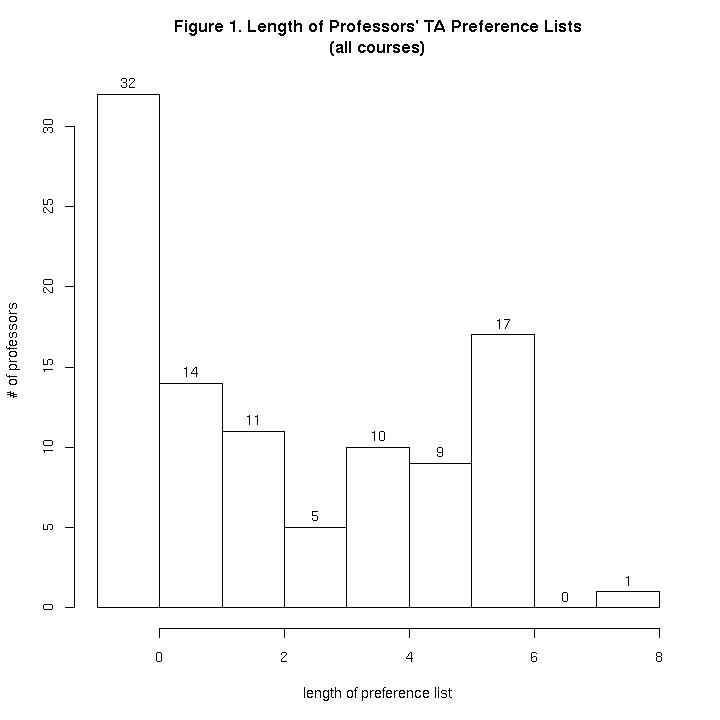
The first histogram (Figure 1) shows the distribution of number
of TA's chosen (from 0 to 8). that is, 32 professors expressed 0
choices (did not answer the question), 14 expressed 1 TA choice, and
so on, up to 1 professor who expressed 8 choices.
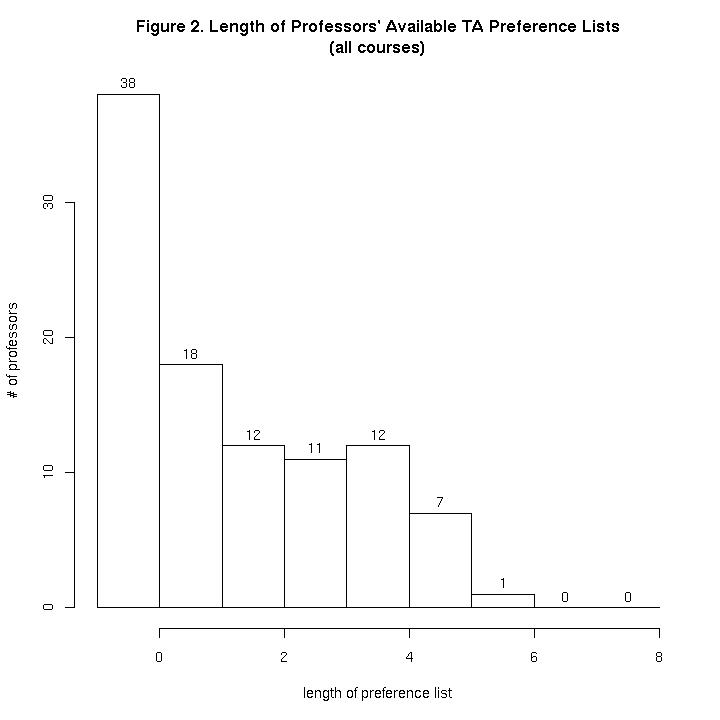
 The second histogram (Figure 2) shows the distribution
of REAL choices -- after unavailable TA's were removed from the
professors' preference lists). 38 professors expressed no choices, 18
expressed 1 choice, and so on. Thus, the maximum length REAL choice
preference list was 6 TA's -- but only 1 professor did that.
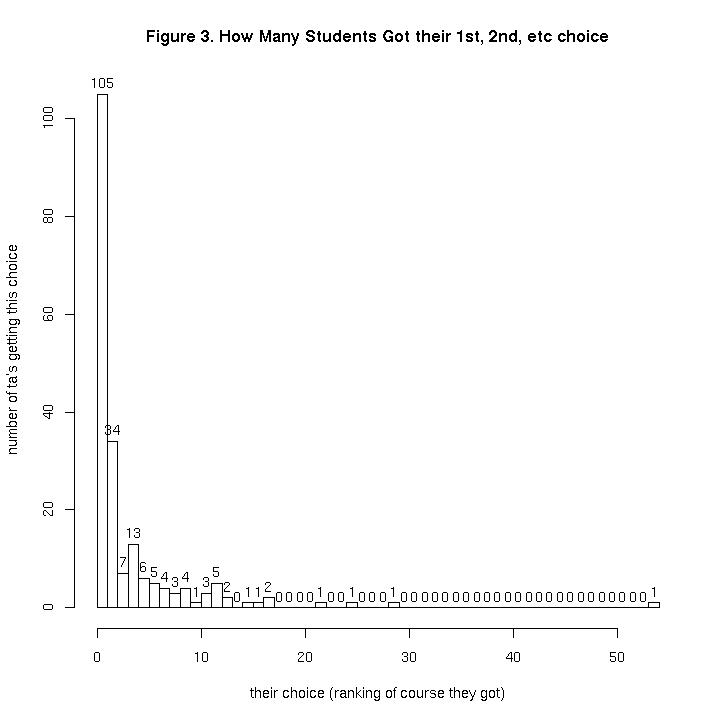
 4) Can you do one of these histograms on how many (students) got
their first, second, third, ... choice?
Figure 3 is such a histogram (although it does not show the 4 students
who did not get matched).
 5) Is there any way to break down the first analysis (of professors'
choices), this time by department - do you have data on which program
each class is?
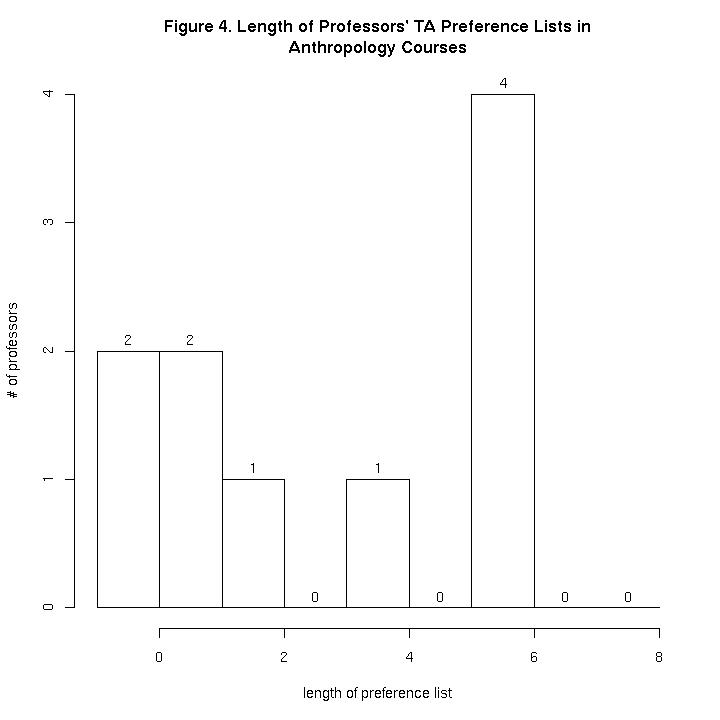
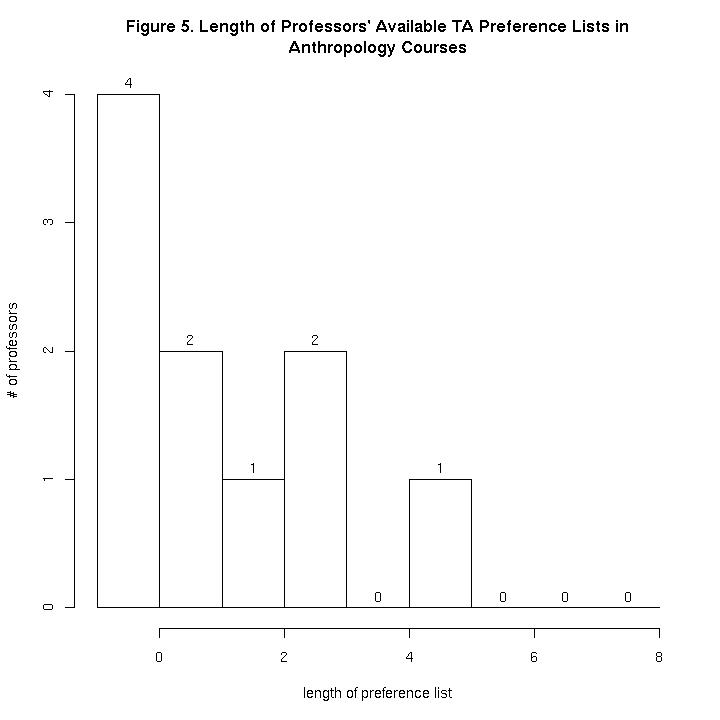
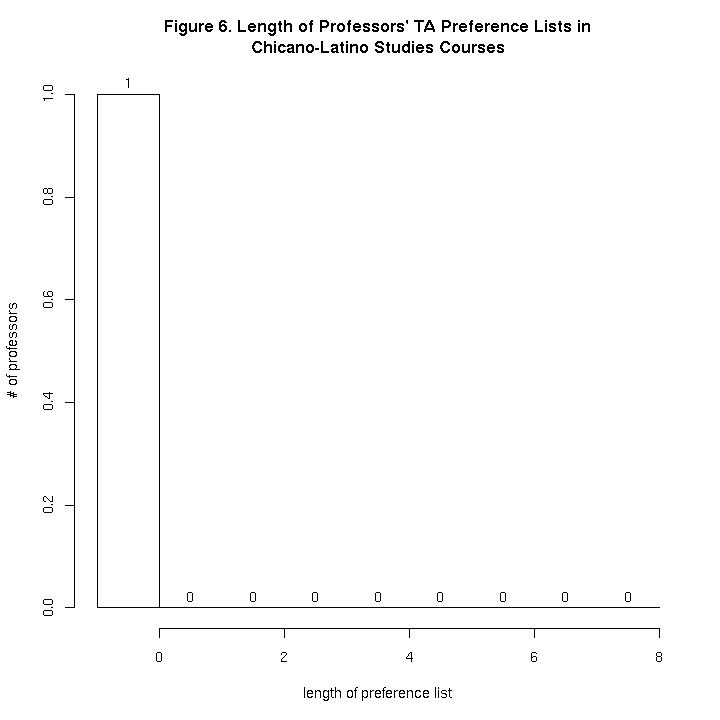
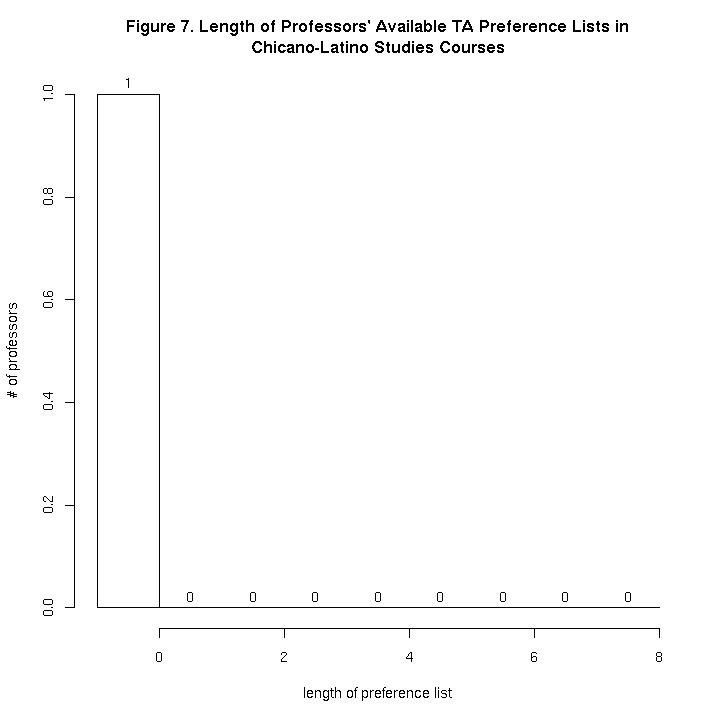
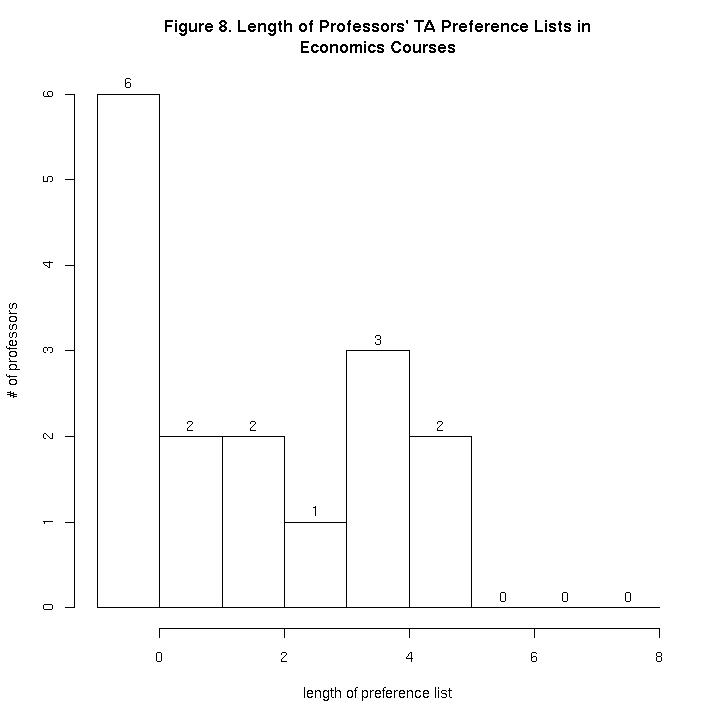
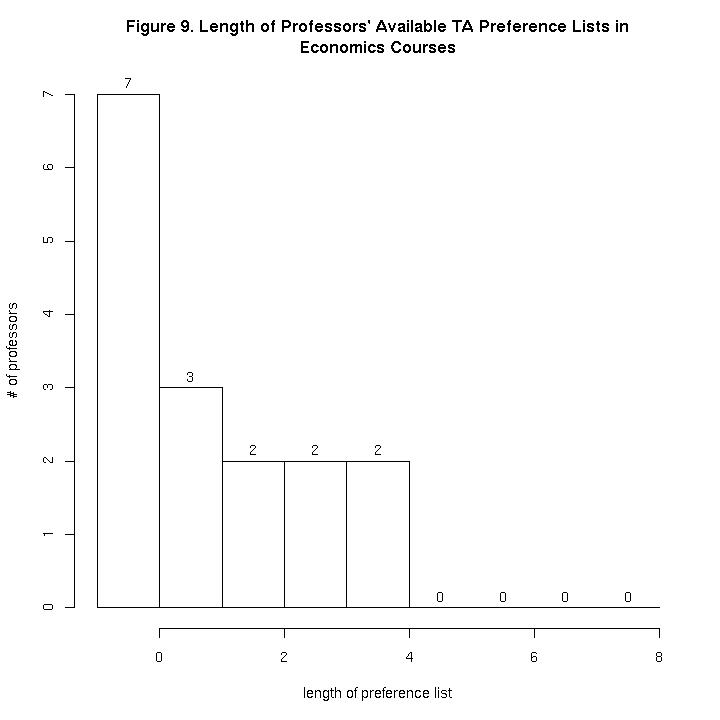
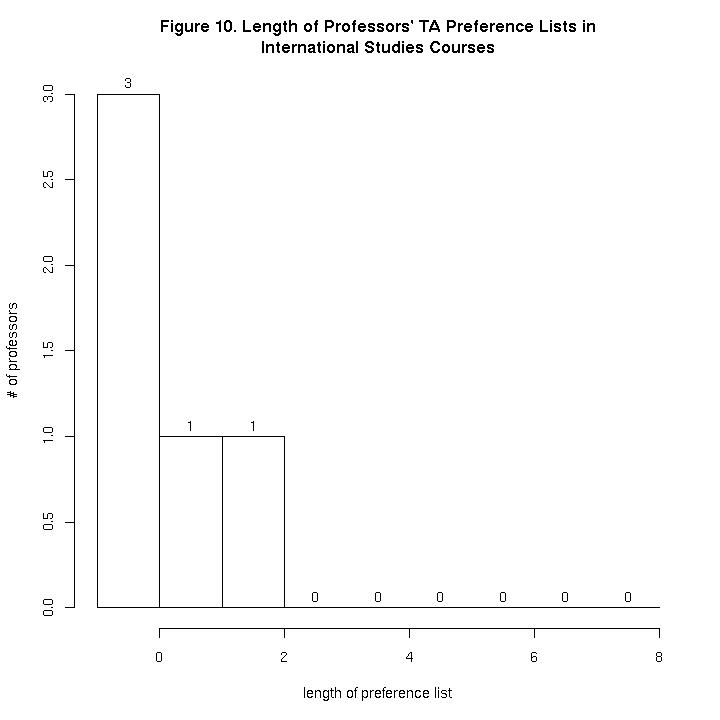
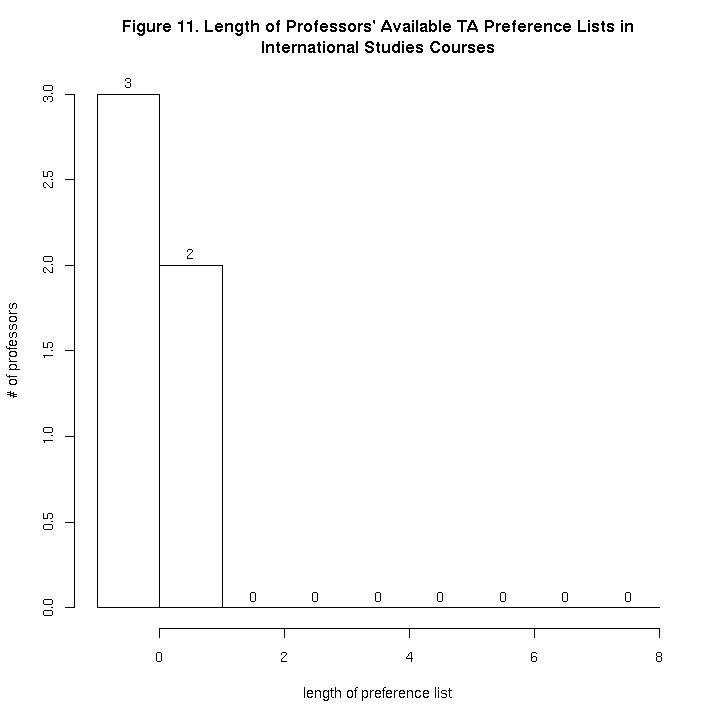
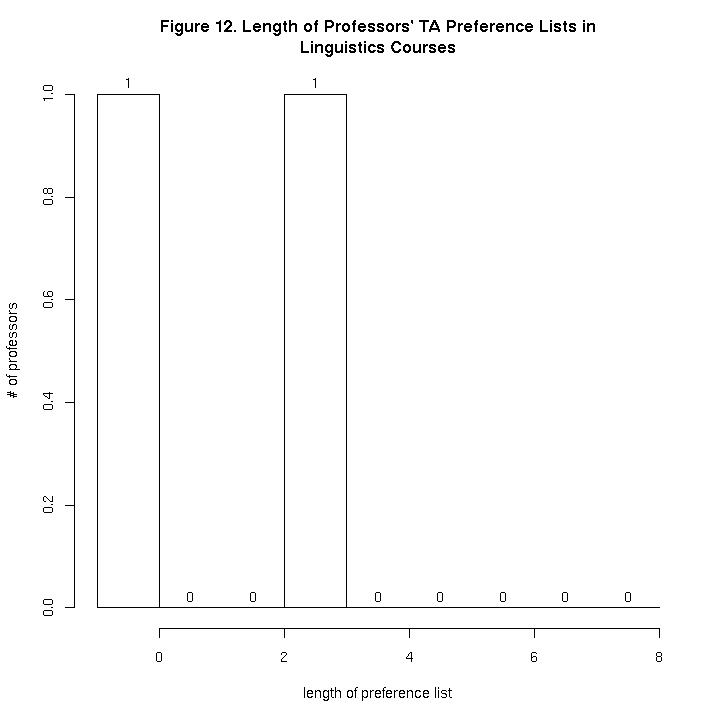
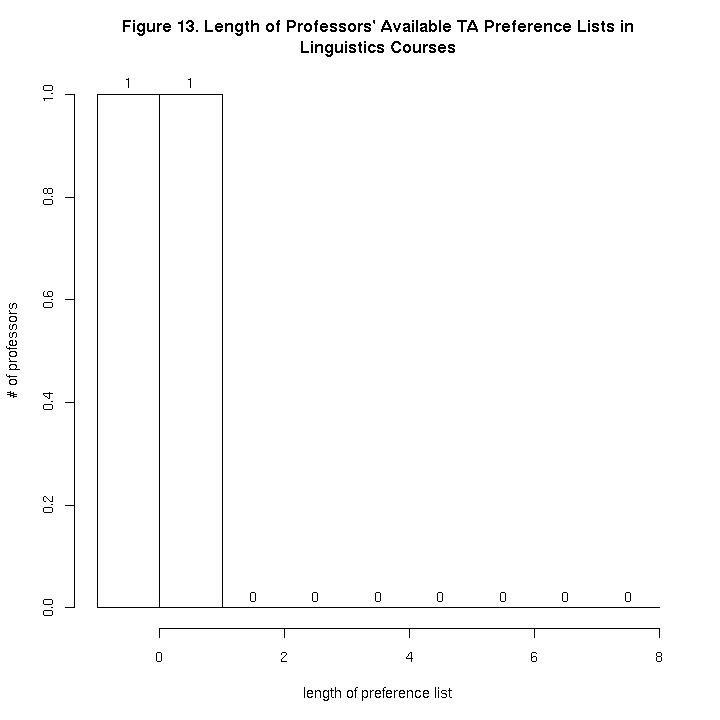
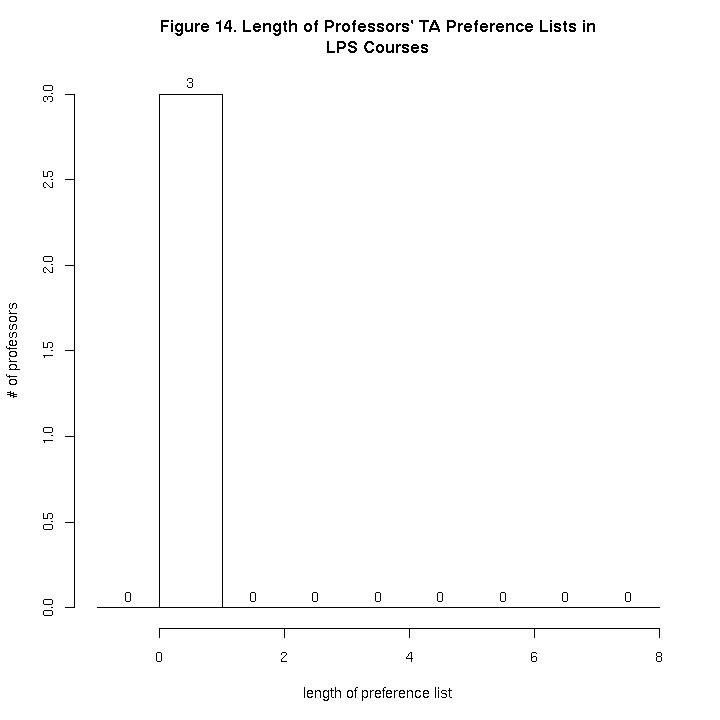
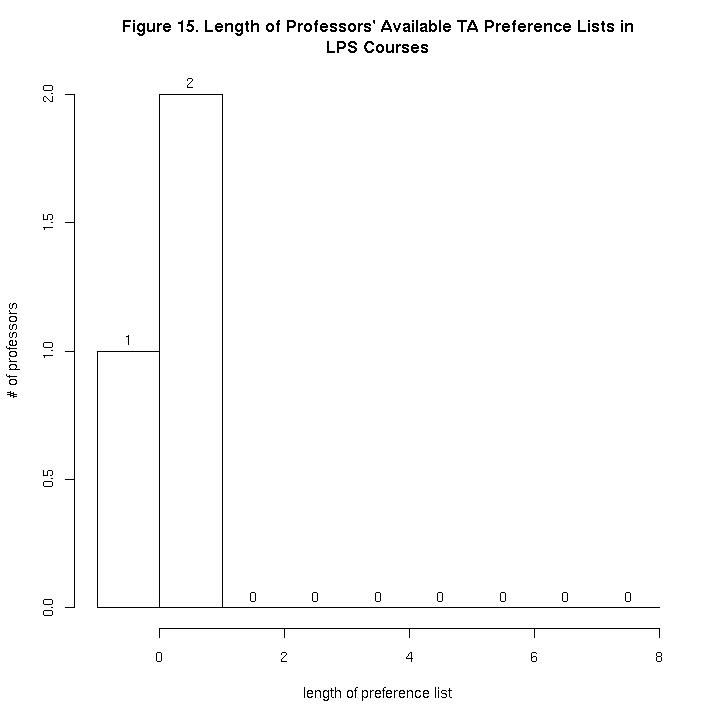
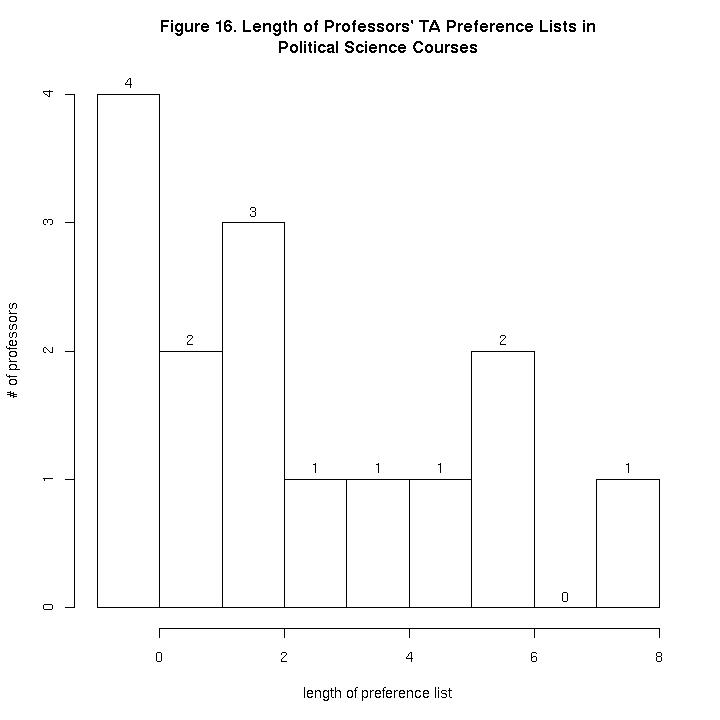
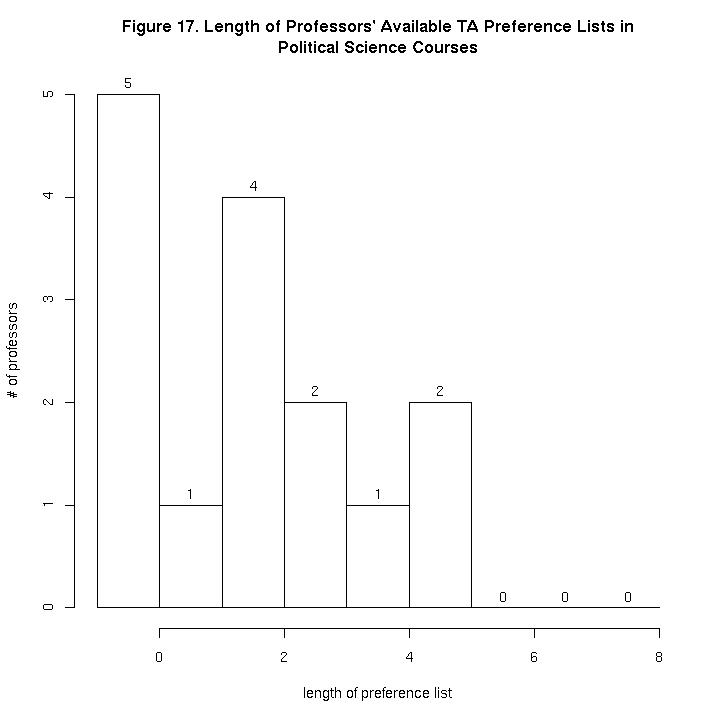
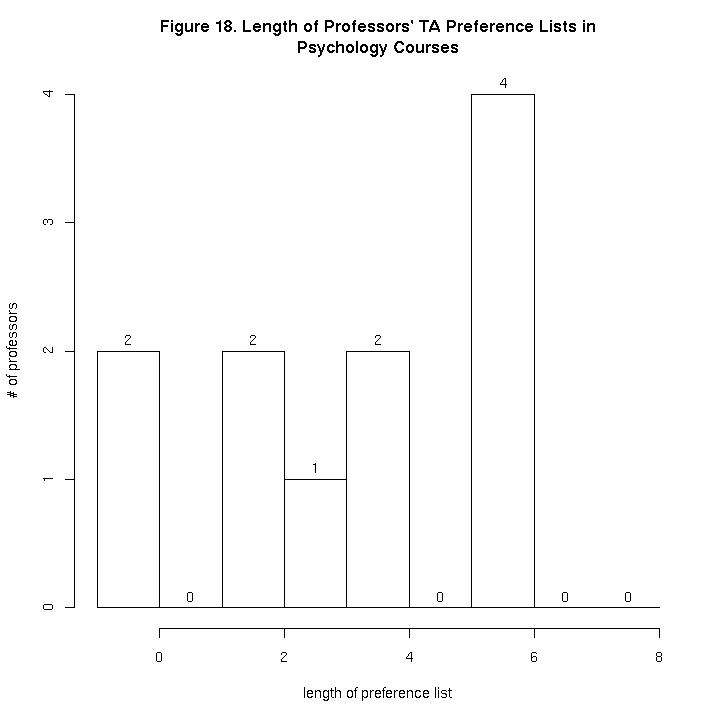
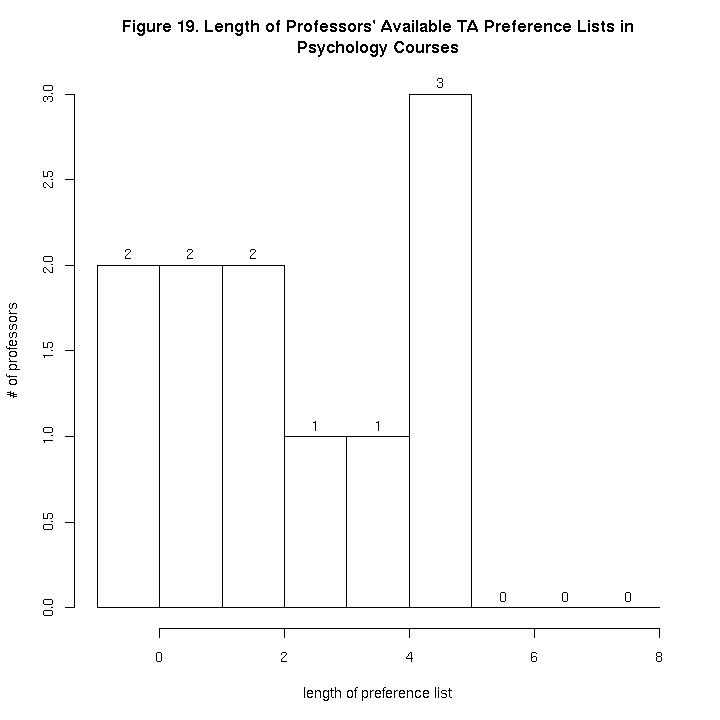
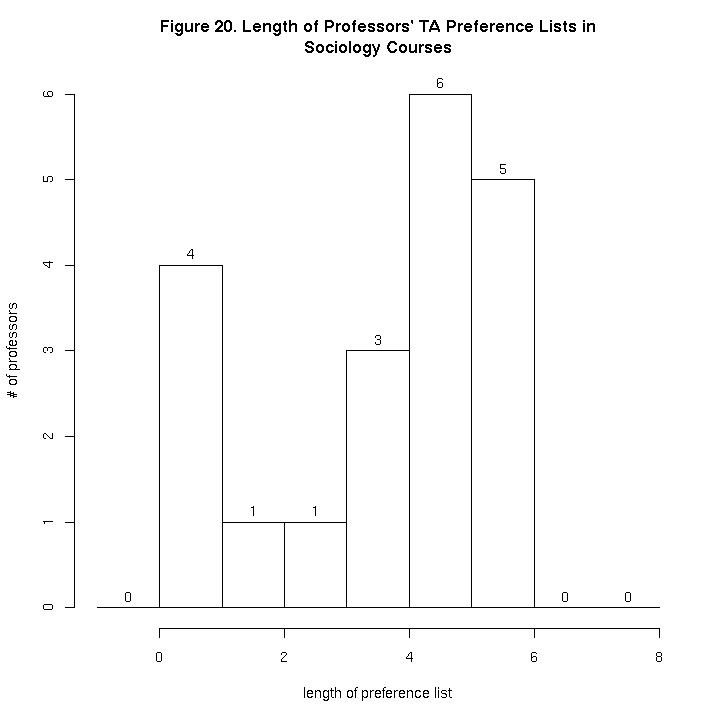
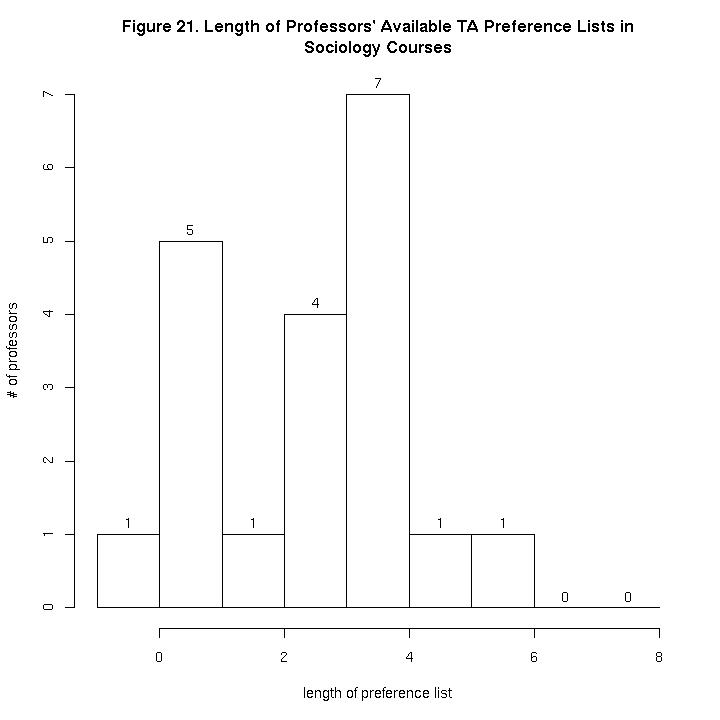
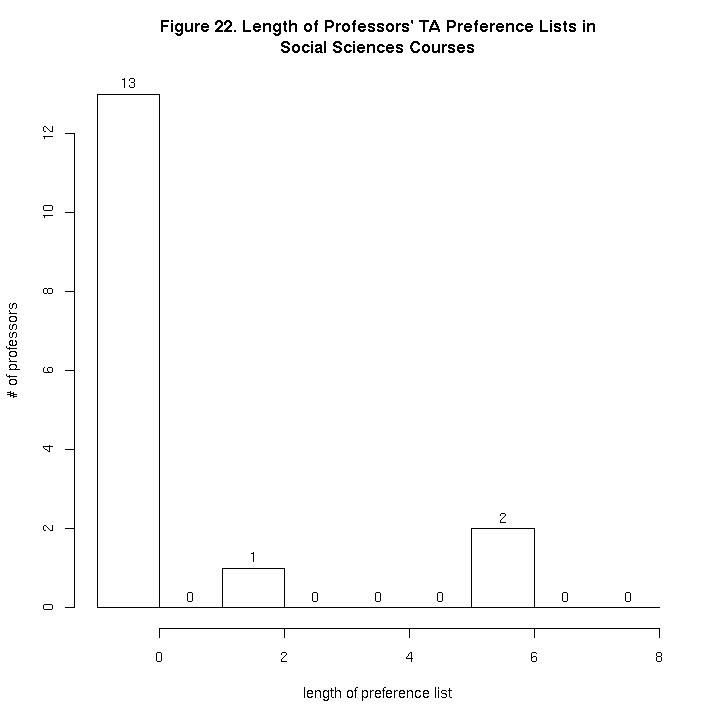
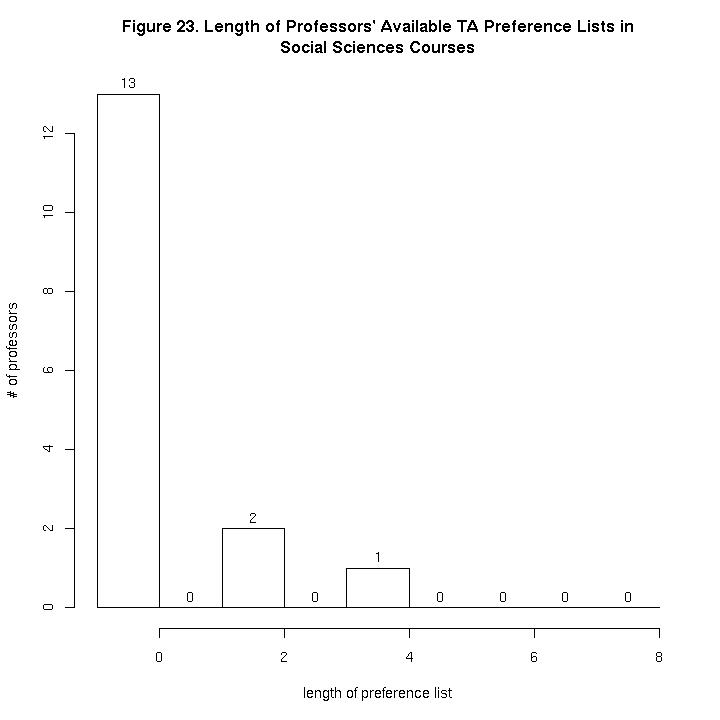
Here are histograms, as with Figures 1 and 2, but now broken down by
each of the 10 undergraduate departments that courses were listed
in. Each department has 2 graphs -- the 1st showing the length of
professors' actual ta preference lists, and the 2nd showing the length
of professors' ta preference lists once they are adjusted to remove
those ta's whose schedules did not match that course, or who did not
wish to ta that quarter at all.
Anthropology
 Chicano-Latino Studies
 Economics
 International Studies
 Linguistics
 Logic & Philosophy of Science
 Political Science
 Psychology
 Sociology
 Social Science
 6) And can you calculate conditional probabilities:
probability of professor getting a ta on the prof's choice list,
conditional on a choice list of 1 available ta; 2 available tas; 3
available tas; etc.
It would be useful to know if the profs who didn't get a requested ta
only put in a request for one student, in which case we could advise
the profs to put down a few choices.
About the conditional probabilities. It would be useful having the
statistic conditional on the number of tas chosen as well as the
number "really" chosen. The professors don't necessarily know whether
�a grad student is available, so the latter number is relevant. On the
other hand, they could ask their students whether they are available -
in which case the second statistic is relevant.
Results:
all ta's:
# ta's chosen # profs choosing total # of profs % of profs
this # of ta's choosing this # choosing this
who got a ta on of ta's. # of ta's who
their preference got a ta on their
list pref list
------------- ---------------- ---------------- -----------------
0 0 32 0%
1 6 14 43%
2 6 11 55%
3 3 5 60%
4 5 10 50%
5 6 9 67%
6 12 17 71%
7 n/a
8 1 1 100%
available ta's:
# ta's chosen # profs choosing total # of profs % of profs
this # of ta's choosing this # choosing this
who got a ta on of ta's. # of ta's who
their preference got a ta on their
list pref list
------------- ---------------- ---------------- -----------------
0 0 38 0%
1 9 18 50%
2 8 12 67%
3 5 11 45%
4 10 12 83%
5 5 7 71%
6 1 1 100%
Lastly, here is an explanation of our algorithm used for TA Course matching.
Back
|